Distributed tracing is incredibly helpful during the integration and optimisation of microservice-rich software. Before implementing tracing as a publicly available feature in the latest version of Acra, we did a small research to catch up with current industry standards in tracing protocols and tools. In this article, we’ve decided to explain, why tracing is a very useful thing and how you can benefit from using it in your projects.
What is tracing
When we say “tracing”, we mean logging where the logs can be logically subdivided into separate streams of consecutive messages and displayed accordingly. Tracing allows better monitor distributed applications for failures and unexpected performance, especially in microservice-rich architectures.
If an app performs the actions in a strictly defined order and displays logs, these logs form a single sequence of messages and no additional actions are required for displaying the order of messages. If an app performs certain actions non-consecutively (in a parallel or distributed way), in this case, it’s hard to understand the order of messages based on logging alone.
Let’s take a simple example – two threads (A and B) are working in parallel, logging actions and error messages. Now, let’s imagine they’ve generated the following log:
* action_1
* action_2
* error
* action_3
A fleeting glance at these messages makes us realise that the error took place after some action, but there is no way to tell, in which thread exactly. To find out, we need to know what error messages can be displayed by thread A and thread B. Following the sequence of logs and errors, we can suppose, which thread ran the action_3 and which failed to execute the action_4.
Things get complicated in large distributed apps with many parallel data processing threads where many unexpected errors can happen. Naturally, it’s also very important for the error messages to be understandable for users, other developers, and the support team.
To streamline and logically separate the data, logs can be tied to one distinct thread:
* ThreadA: action_1
* ThreadB: action_2
* ThreadB: action_3
* ThreadA: error
It’s much easier to understand where the error takes place in such log. If a service for collection and processing of logs is used, logs can also be arranged by threads:
* ThreadA: action_1
* ThreadA: error
* ThreadB: action_2
* ThreadB: action_3
Basically, we’ve tagged each message with the name of the thread to make it easier to identify the behaviour of threads and source of errors. Such logging – displaying a consecutive stream of messages, grouped by some characteristic feature – can be called tracing.
Tracing is useful for both developers and DevOps
In the example above, tracing simplifies debugging, search for problems on different stages of development, and testing for the developer team. But it also becomes almost irreplaceable and especially crucial for DevOps engineers when the software suite has already been written, for the reasons of deployment and support. Tracing provides a way to monitor and follow the processing of separate requests on all the components of the software suite and to get the metrics tied to certain exact portions of data.
The most common use cases for tracing are:
Debugging of distributed applications to catch “tricky” bugs;
Monitoring and optimisation of high-load requests;
Checking the performance of load balancers;
Checking the correctness of filtering rules;
Monitoring and alerting system events;
Using tracing as the source of data for SIEM;
Investigation of security incidents, retracing the history of actions.
If you want to try tracing as we’ve implemented it in Acra, see Acra Engineering Examples.
Discover Acra examples Check Acra protection features
Why did we want to implement tracing
While working on security software, we found tracing to be an invaluable tool for keeping an eye out for the real performance stats of the systems. After conducting an online survey, we were surprised to find out that tracing is a practice ignored by the majority of the developers we asked. So what did we need tracing for?
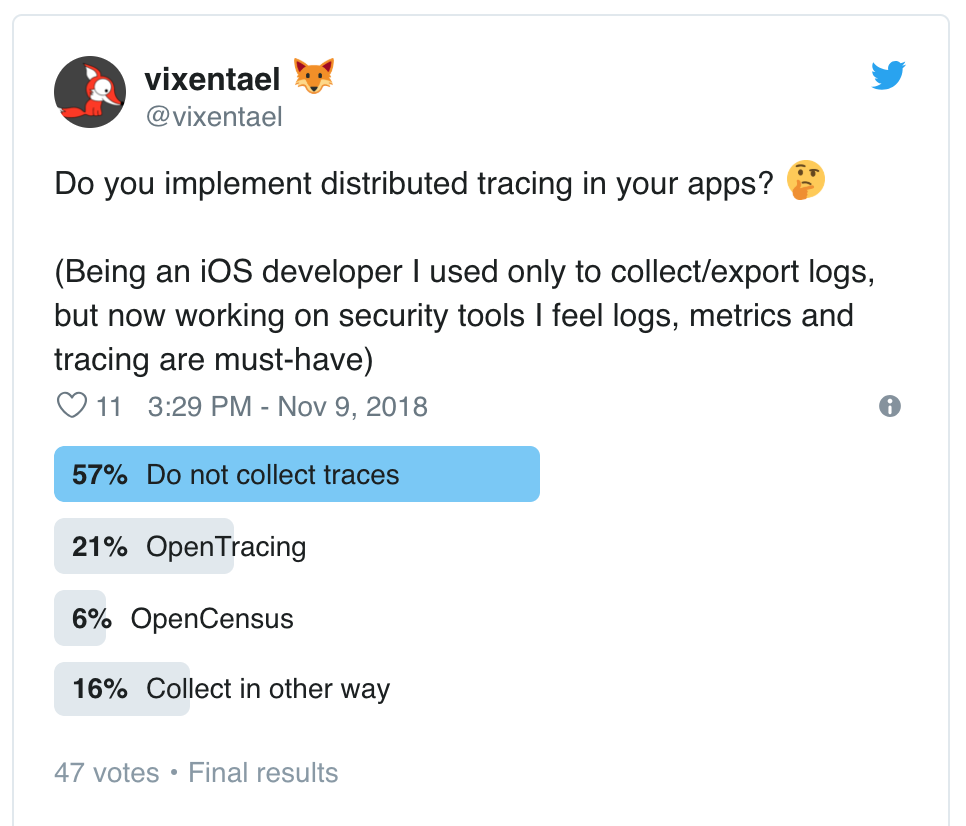
An online survey conducted on Twitter by our product engineer Anastasiia Voitova. Her followers don’t use tracing a lot, but many of them mentioned logging tools.
We’ve created and are continually updating the open source version of data protection suite Acra. Acra helps to encrypt data in web and mobile applications, minimises the leakage scope, detects unauthorised behaviour, and prevents data leakages, informing the operators of a security incident underway.
Acra consists of several data processing modules. To illustrate tracing in Acra, we’ll look into the two of them: AcraConnector and AcraServer. The web application sends data through AcraConnector, which adds the transport encryption layer. AcraServer receives and processes this data – it firewalls the requests, talks to the database, detects abnormal behaviour and possible intrusions, and decrypts data when required. Each of the services consists of several modules (network, data filtration and storage, cryptography).
This results in a multi-stage data processing workflow:
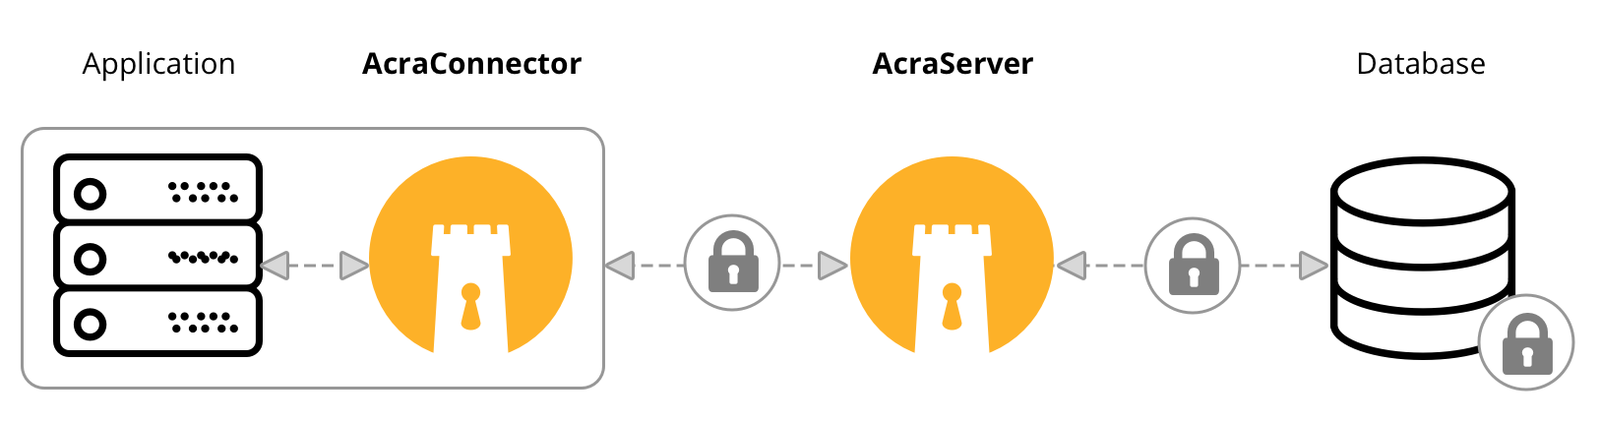
Simplified data flow: from the client application through Acra components to database and back. You can read more about the way Acra works in Acra’s README or go deeper and see the full documentation for Acra.
On the early development and testing stages for Acra, simple logging was enough. The data was processed consecutively – one client application connected to one database through one AcraConnector and AcraServer; the logs were easy to read. But as we expanded the functionality of Acra, added new components, and carried out testing in a high-load environment with different clients and several databases, it became obvious that we needed more info about the way the data was processed.
We wanted to understand how data request gets into AcraConnector and goes through processing functions of AcraServer until it reaches a database. We wanted to know in which point errors occur, and we wanted to monitor, which functions were executed more often, which – less often, which take the longest to run, etc.
We’ve been already using metrics to monitor the processing functions (i.e. the number of requests per second, data decryption per second, blocked suspicious SQL queries), but tracing illustrates the whole data flow and is more convenient. We used tracing for aggregating data requests from client applications, analysing performance drawbacks, and monitoring the sequence of requests during a client session.
The existing tracing solutions we tried. OpenTracing vs OpenCensus
Since we’re creating a tool that we know will be integrated into infrastructures, it was important to not just “get tracing done”, but to make it compatible with the existing industry standards and easily integratable. In the security world, there are existing techniques for automated detection and response to incidents, events, and actions (i.e. SIEM systems). Earlier, we’ve added logging in the CEF format for better integration with popular SIEMs.
When searching for a tracing library, we discovered that many approaches were based on the paper about Dapper by Google. There was also an already existing API for tracing – OpenTracing.io, supported by such trace collecting services as Zipkin, Jaeger, Datadog, Lightstep.
And then, there was OpenCensus.io – a collection of libraries that offer an abstraction for exporting traces and metrics to different collector services.
For our needs, we had to choose between OpenTracing and OpenCensus so we defined the pros and cons of integrating and using those services.
OpenTracing
Pros:
De-facto industry standard used in many tracing libraries and collecting services;
Open and free, initially designed for tracing in distributed services;
There are ready-made libraries for different languages and platforms for exporting traces from an app;
You get good karma points for using and passing on a standard accepted by the com
Cons:
The API assumes that there will be only one implementation of tracing in your app, a global object (Tracer) responsible for the creation and serialisation of the trace and its blocks.
Since it is just a standard, it has no distinct requirements towards the implementation. In fact, there are two types of libraries for different languages. The first type allows integrating into your code only placeholders for collecting and exporting traces (this is convenient for those who write their own libraries). The second type consists of the libraries provided by certain existing tracing exporting services that use their file formats and serialization rules. Basically, you need to either stick to the exact library from one of the existing services or write your own implementation.
The standard sets no requirements towards data serialisation and configuring of the exporters, so it might be difficult to switch one tracing service for another one.
OpenCensus
Pros:
Ready-made implementation and a closed ecosystem with its own formats that also supports conversion into third-party formats;
Allows exporting both traces and metrics into several services at once;
Supplies ready-made implementations for exporting metrics and tracing into various services, for different languages;
Supplies their own implementation of data serialisation into a binary format or using http headers;
Has their own in-process web pages that display collected data from the process that they are attached to (zPages), which are very handy during the development for data visualisation;
The API is similar to Dapper and OpenTracing. There is no conceptual difference so once you’ve learned to work with it, it won’t be hard to switch.
Cons:
Incompatible with OpenTracing. Despite the conceptual similarity, OpenCensus cannot be used as an implementation of OpenTracing interfaces;
Different languages and services are supported in a different way. For instance, the export to Jaeger is only supported for Go and Python, export to Prometheus – only for Java and Python. Which leaves us with a considerable amount of mismatched languages and services.
We ended up opting for OpenCensus for the following reasons:
It has a good support of the languages that we use for Acra (Python, Go);
During the development process, we could use several trace exporting services at once. We used tracing both during automated and local testing. It was also very convenient to setup the local Jaeger container for visualising the traces;
It supports collecting metrics and exporting them into various services including Prometheus. We already collect metrics and export them to Prometheus, so using OpenCensus allows us to have a single library for both tracing and metrics;
OpenCensus is conceptually similar to OpenTracing and the approaches described for Dapper. Usage of OpenCensus provides a useful experience for our team in case we decide to switch to OpenTracing later;
Since vast majority of customers still use no tracing at all, we’ve listened to those who do – and they seem to favor OpenCensus. In the end, after implementing one tracing scheme, migrating to OpenTracing is less of a challenge.
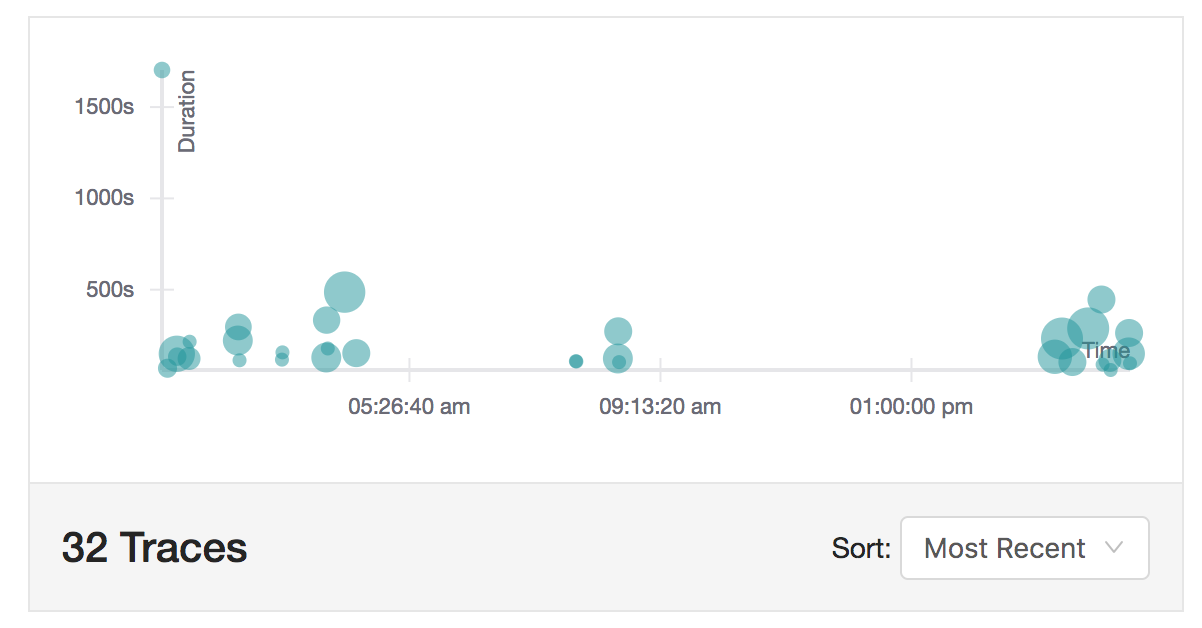
Jaeger shows how long the traces take.
How we integrated tracing – the specifics of sending traces in network requests
Our goal was to visualise the data processing from the client application through our service, to the database, and back.
The starting point for data processing is AcraConnector. At the beginning of processing data from the client application, we were creating an initial trace with a unique number (traceID). This ID was used inside the code of AcraConnector and then passed over to the AcraServer’s side.
AcraConnector wrapped each step of data processing into a logically connected block called “span” in OpenTracing terminology. Then it sent the data with traceID to the AcraServer. And there we stumbled upon the first issue.
var span *trace.Span
if server.config.WithConnector() {
spanContext, err := network.ReadTrace(wrappedConnection)
if err != nil {
log.WithError(err).Errorln("Can't read trace from AcraConnector")
return
}
ctx, span = trace.StartSpanWithRemoteParent(wrapCtx, callback.funcName, spanContext, server.traceOptions...)
} else {
ctx, span = trace.StartSpan(wrapCtx, callback.funcName, server.traceOptions...)
}
span.AddAttributes(trace.BoolAttribute("from_connector", server.config.WithConnector()))
defer span.End()
wrapSpanContext := wrapSpan.SpanContext()
// mark that wrapSpan related with new remote span
span.AddLink(trace.Link{TraceID: wrapSpanContext.TraceID, SpanID: wrapSpanContext.SpanID, Type: trace.LinkTypeParent})
AcraServer is trying to get span context from the network request from AcraConnector and if it fails – it creates a new span.
Before sending the data, we created an encrypted connection between AcraConnector and AcraServer with the help of Themis Secure Session or TLS. AcraConnector wraps the connection initialisation into a separate span to estimate the connection setup time. But AcraServer still doesn’t know the traceID before the connection is established. How can establishing connection span be linked to the same traceID on both sides? We thought about creating a temporary traceID on AcraServer’s side and substituting it for the one received from AcraConnector after establishing the connection. But the OpenCensus Go library only operates on immutable objects.
func processHTTPConnection(parentContext context.Context, ..) {

spanCtx, span := trace.StartSpan(parentContext, "processHTTPConnection")
defer span.End()
logger := logging.LoggerWithTrace(spanCtx, logging.GetLoggerFromContext(parentContext))
...
}
The simplest way to add tracing at the beginning of processing function: traceID is a part of the parentContext.
We also thought about forking the library and doing a PR with the mutable objects we needed, but then we decided to disregard the fact that one of the spans didn’t fit the general flow since everything is monitored and exported separately (establishing of connection between AcraConnector and AcraServer on the other side). It’s worth adding that, in fact, the time of establishing the connection should also be the same for both sides, which is why this span does not carry crucially important info.
We’ve integrated tracing easily enough into the places where the data is being processed. Mostly – thanks to the modular nature of our codebase – we simply added trace IDs and spans into the state objects (contexts) we work with in our code.
// LoggerWithTrace return logger with added span_id/trace_id fields from context
func LoggerWithTrace(context context.Context, logger *log.Entry) *log.Entry {
span := trace.FromContext(context)
spanContext := span.SpanContext()
if getTraceStatus(context) {
return logger.WithFields(log.Fields{"span_id": spanContext.SpanID, "trace_id": spanContext.TraceID})
}
return logger
}
Improving functionality of our logger by adding tracing details.
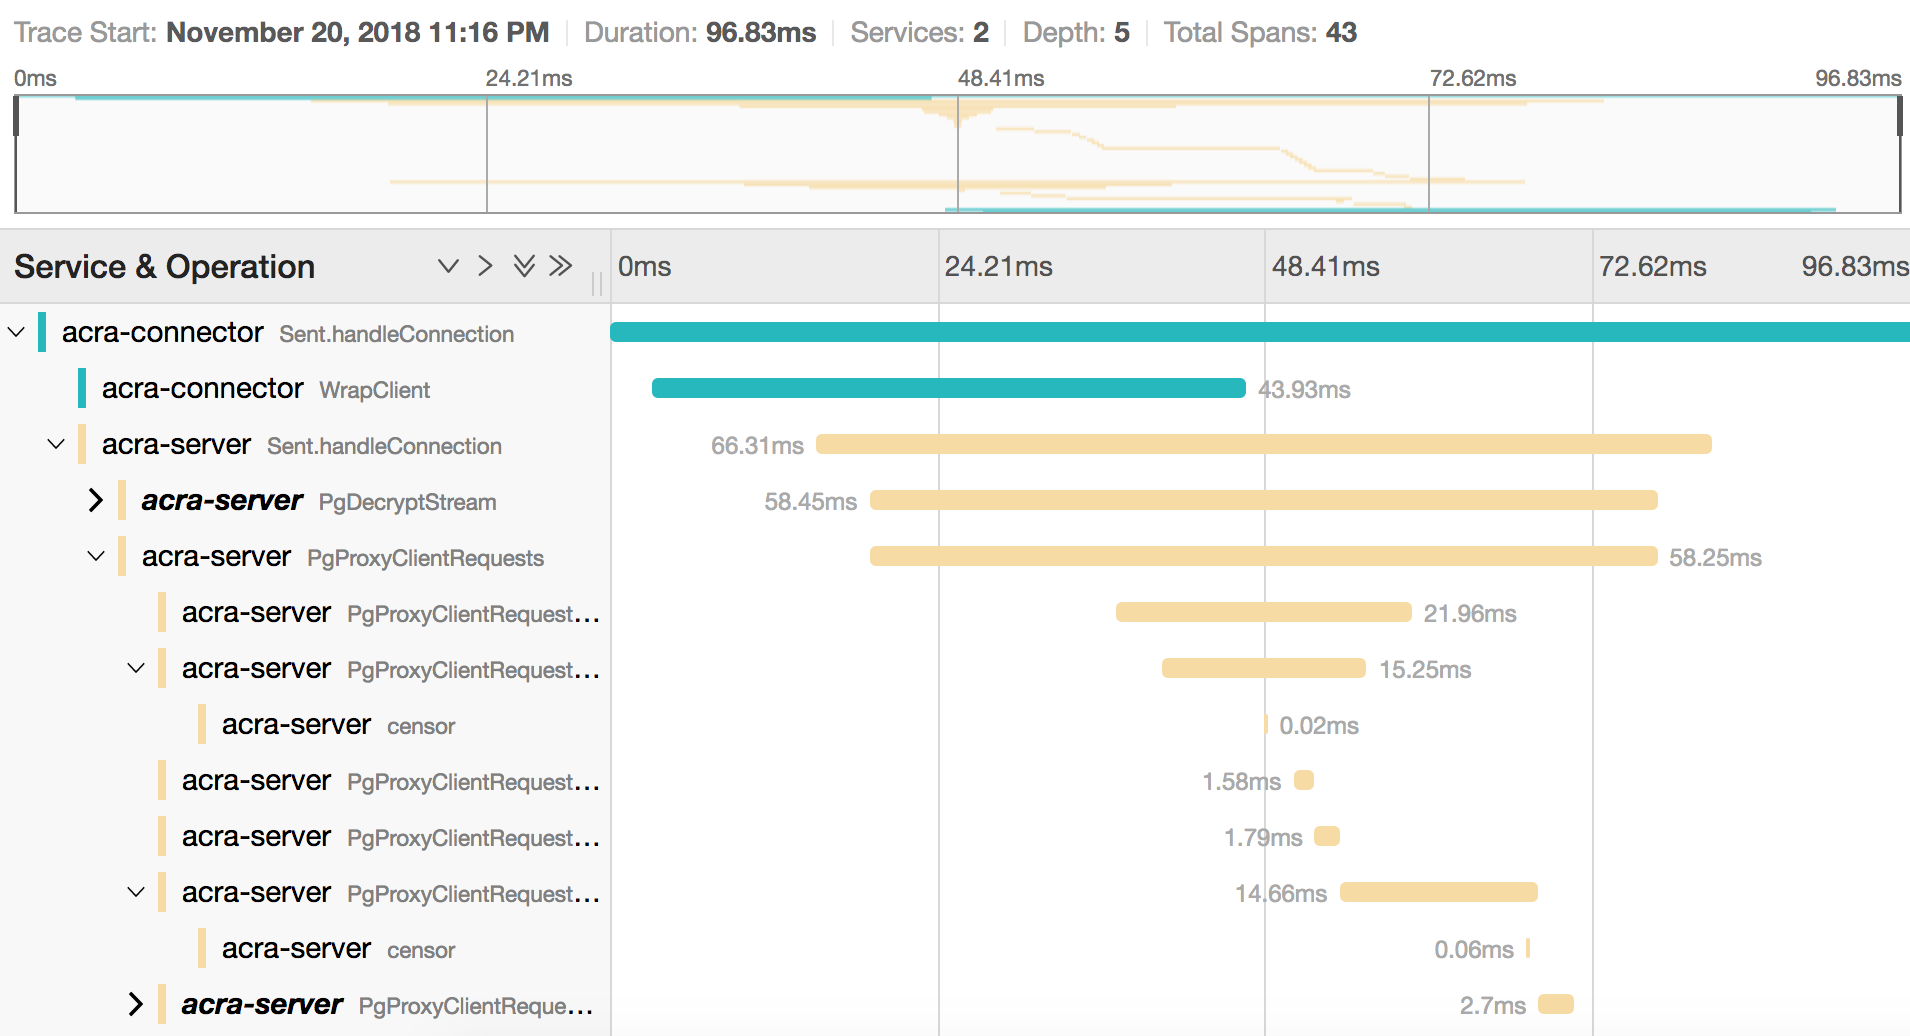
Acra traces in Jaeger.
We think that it’s more complicated to integrate tracing into apps where there is little control over the start of the data processing (i.e. when you’re using a web framework for processing network requests). In such cases, it’s necessary to embed the tracing logic into the framework itself or use frameworks that support tracing (i.e. gRPC server and some web frameworks support OpenTracing).
The advantages of using tracing for us
Testing the app got much easier. We have very detailed, yet complicated integration tests and it was always hard to understand where exactly errors occurred. Tracing brings a great advantage for our software and customers’ infrastructures where there are many parts of the whole, network connection, cryptography, and a possibility of potential malicious attacks.
Tracing is a good way to analyse the performance of different modules of the system. Previously we suspected that one of our modules worked slower than it should and we could neither prove or disprove those suspicions. After test-running our app with the tracing on under a high load, we realised that our suspicions were wrong – the module wasn’t lagging.
Tracing is extremely helpful during the implementation and usage of our system – customers’ DevOps engineers do not get a black box, but receive a full-blown software suite with logs, metrics, tracing, which is also easy to integrate with various data exporters and SIEM systems. So DevOps engineers can predict and measure the performance on Acra in the complex schemes with load balancing.
Tracing makes our software more appealing for the enterprise segment. Acra takes an appropriate place in the SIEM systems and tracing is used during the analysis of various potential attacks and leaks.
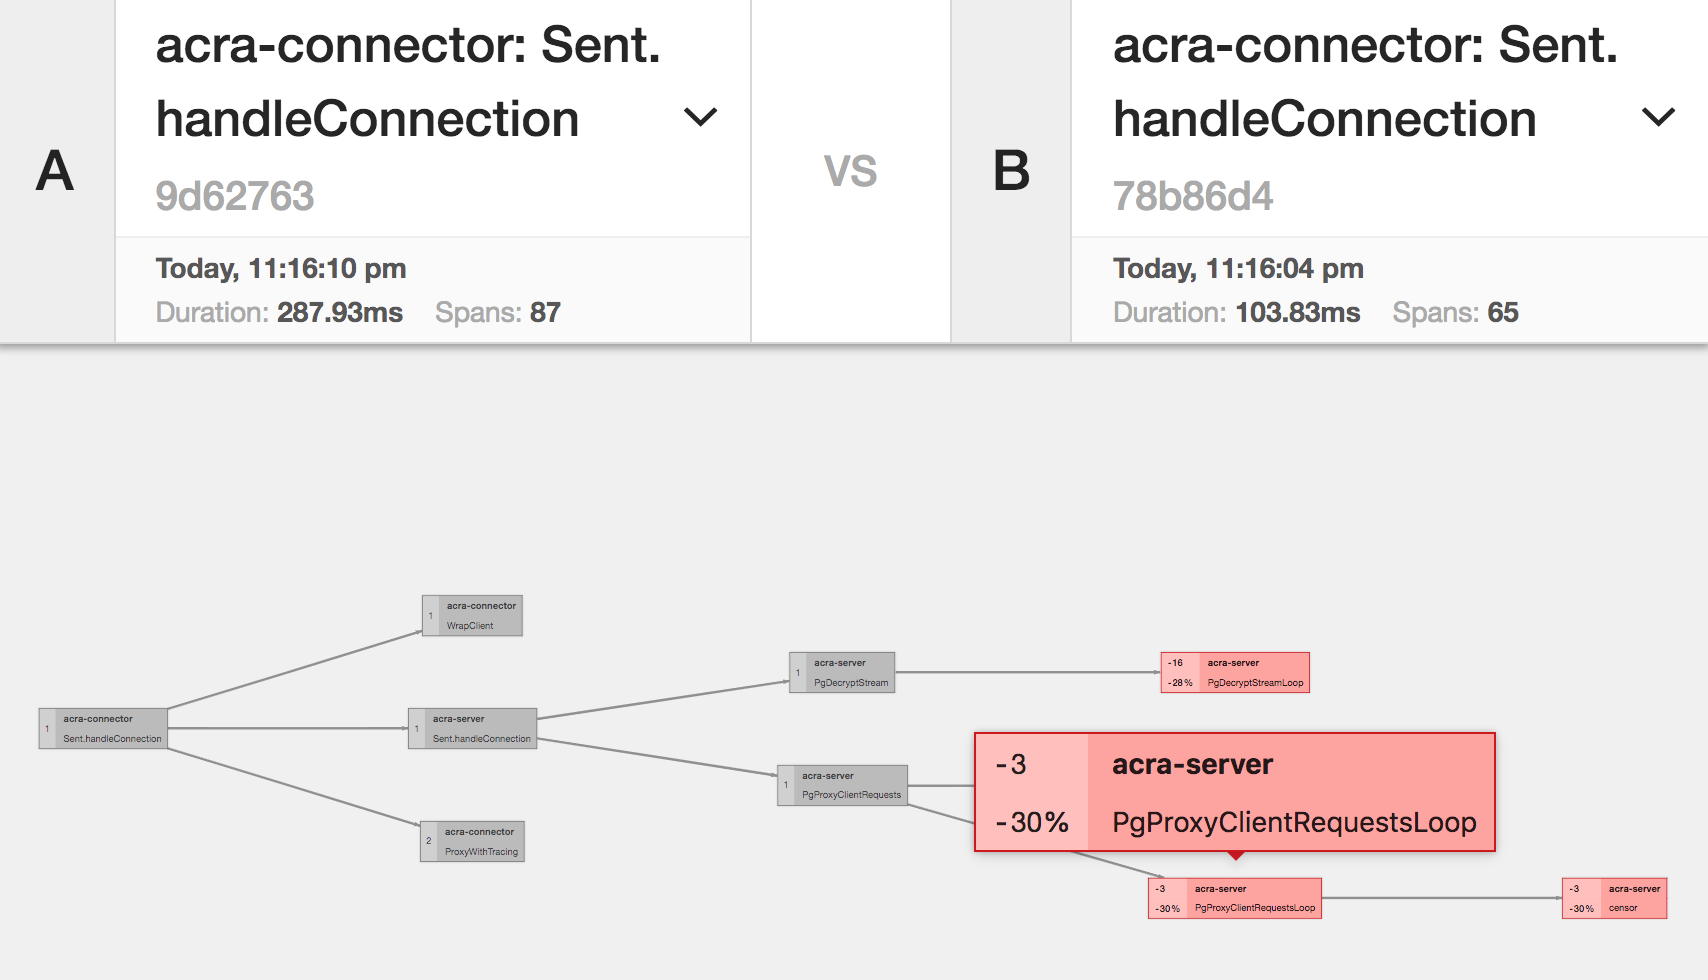
Jaeger allows comparing similar traces to find out, which span takes more time.
Summary
Tracing is very convenient, especially when it comes to distributed systems. It works really well in combination with high-quality logging and aggregation of metrics. Sometimes implementing tracing can demand a considerable refactoring of the architecture and communication protocols between the software modules (for transferring the traceID identifiers).
Who actually needs tracing?
If you need tracing for your internal products – do a “market research” and select the most suitable solution for your DevOps engineers among existing services.
If you know that other developers are going to use traces from your software, it is important to take into account the compatibility of data formats, the possibility to export to 3rd party services, and the difference between OpenTracing and OpenCensus.
To try Acra on our web server without coding a single line, request access to Acra Live Demo.